Used Car Prices by State: Where Cars Are Cheapest (and Most Profitable)

In this article (8 sections)
- Why Used Car Prices Vary So Much by State
- 2019 Honda CR-V (EX, 50K–65K miles) — Price by State
- 2018 Toyota Camry (SE, 55K–70K miles) — Price by State
- 2020 Ford F-150 XLT (4x4, 45K–60K miles) — Price by State
- The Top Source States for Each Strategy
- How to Actually Execute Interstate Arbitrage
- The States to Watch in 2026
- What This Means for Your Buying Strategy
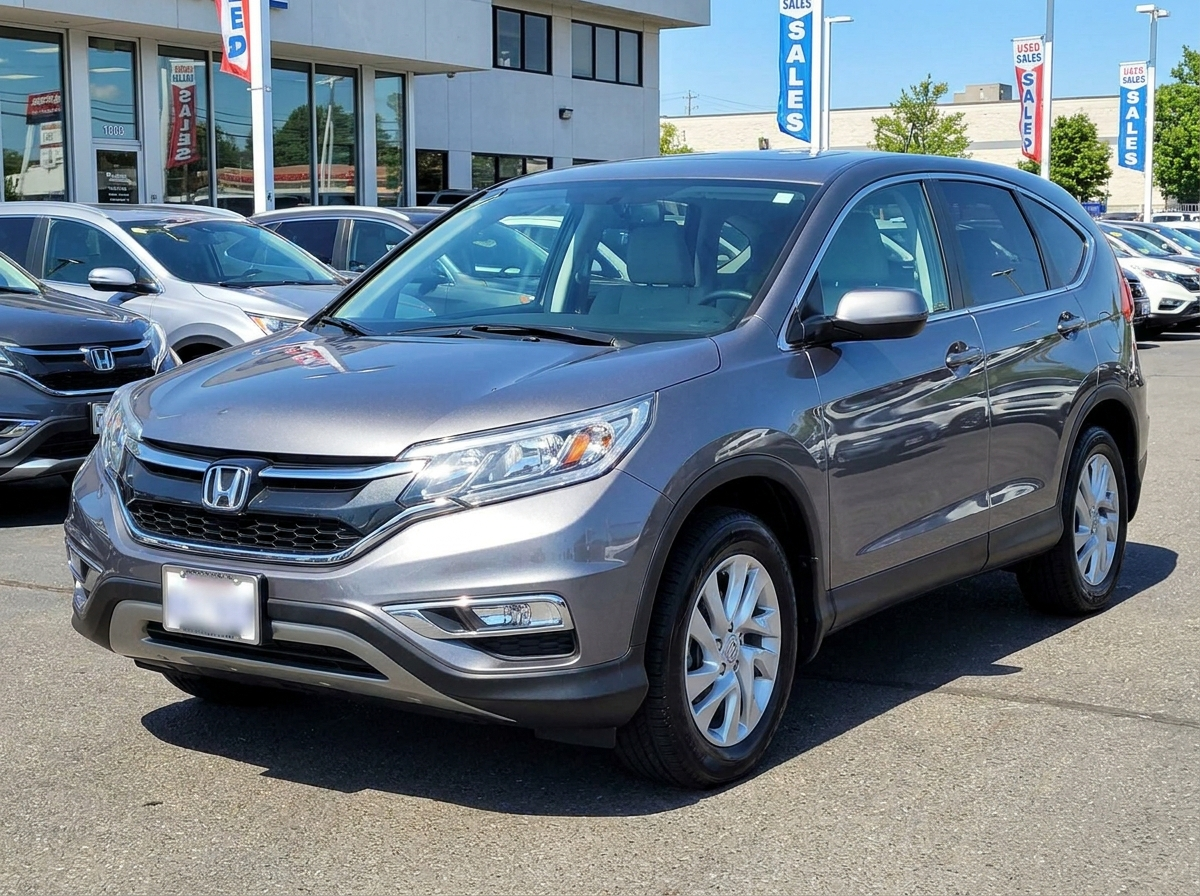
The same 2019 Honda CR-V with 55,000 miles is not worth the same amount in Ohio and Florida. It might be listed for $16,800 in Columbus and $20,400 in Tampa — a $3,600 spread on a single vehicle. That gap is not an accident. It reflects supply, demand, climate, income levels, and buyer behavior that vary dramatically by state.
For car buyers, this means you can save thousands by sourcing from the right state. For flippers and dealers, it means the spread between source markets and destination markets is a structural profit opportunity — if you know where to look.
This post breaks down used car pricing by state using data from our database of 2M+ listings, focusing on three popular models: the 2019 Honda CR-V, the 2018 Toyota Camry, and the 2020 Ford F-150.
See price differences across all 50 states.
Analyze 5 Cars FreeLocalIQ™ market snapshot
What top flip candidates are asking right now
| Model | Listings | Median asking price |
|---|---|---|
| GMC Sierra 1500 | 523 | $29,995 |
| Chevrolet Silverado 1500 | 1,367 | $25,000 |
| Toyota Tacoma | 1,164 | $27,516 |
| Ford F-150 | 2,592 | $23,995 |
| Ram 1500 | 992 | $22,900 |
| Ford Mustang | 571 | $20,995 |
| Jeep Wrangler | 548 | $25,089 |
| Chevrolet 1500 | 539 | $20,900 |
LocalIQ™ asking-price median · 8,296 listings · updated every 6 hours. National, last 8 model years; asking price is your resale ceiling, not a promised sale price.
Why Used Car Prices Vary So Much by State
Before the numbers: a quick primer on what drives interstate price variation. Understanding the causes tells you which spreads are structural (persistent, reliable) versus situational (temporary, harder to exploit).
Climate and Vehicle Condition
Sun Belt states (Florida, Arizona, Texas, California) produce vehicles with minimal rust, intact undercarriages, and low weather-related wear. Rust Belt states (Ohio, Michigan, Pennsylvania, Illinois, New York) produce vehicles that have weathered years of road salt and freeze-thaw cycles. Buyers in every market know this — and it is priced in.
A 2018 Camry from Phoenix commands a premium in Detroit not because Phoenix has higher demand, but because buyers in Detroit are paying for rust-free condition. Transport a clean Sun Belt car north and you capture that premium.
Supply and Demand Imbalances
Trucks are overrepresented in the South and Midwest where they are lifestyle vehicles, not just tools. That supply glut pushes F-150 prices down in Texas and Tennessee. Move those trucks to California or the Northeast, where supply is tighter and pickup culture is less dominant, and prices rise.
The inverse is true for hybrid and electric vehicles: California and the Northeast have high supply (and thus lower prices in some segments) because these markets adopted EVs earlier. Import those vehicles to Midwest or Southern markets with lower EV supply and you can often sell for more.
Income and Affordability
State median income directly affects what local buyers will pay. Luxury model prices in New York or California reflect a buyer pool with higher affordability. The same vehicle in Mississippi or Arkansas faces a more price-sensitive market. This creates segment-specific pricing differences that are not always intuitive.
2019 Honda CR-V (EX, 50K–65K miles) — Price by State
The CR-V is one of the most liquid used vehicles in America. Here is how prices vary across key states:
2019 Honda CR-V EX — Average Asking Price by State
The spread: $4,400 between the highest (California) and lowest (Michigan) markets on the same vehicle.
Why it works: Michigan buyers discount CR-Vs sourced locally because they know the rust risk — even on clean-title cars, buyers assume salt belt wear. A California or Arizona CR-V sold in Michigan commands a $1,500–$2,500 premium over a local equivalent.
Flip strategy: Source clean-title CR-Vs from Arizona, Nevada, or Texas. Transport to Florida, California, or the Northeast. The $3,000–$4,000 spread survives $800–$1,200 in open-carrier transport and leaves a real margin.
2018 Toyota Camry (SE, 55K–70K miles) — Price by State
The Camry shows similar patterns to the CR-V but with some regional quirks driven by local sedan demand.
2018 Toyota Camry SE — Average Asking Price by State
The spread: $3,700 between Florida and Michigan.
Why it matters: The Camry is interesting because the Sun Belt premium is even more pronounced than on the CR-V. Florida buyers — many of them retirees or near-retirees who prioritize condition — will pay a meaningful premium for a clean-title Camry with documented service history from a dry-climate state.
Flip strategy: Source 2016–2019 Camrys from Texas, Arizona, or Nevada at auction or private sale. Target Florida, Georgia, and California as destination markets. The vehicle's condition story (desert/Sun Belt provenance) becomes a selling point you can highlight in your listing.
2020 Ford F-150 XLT (4x4, 45K–60K miles) — Price by State
Trucks tell a different story from sedans and crossovers. The price gradient reverses in some cases.
2020 Ford F-150 XLT 4x4 — Average Asking Price by State
The spread: $6,700 between Texas and New York on the same truck.
Why the reversal: Unlike sedans where Sun Belt = premium, trucks command their highest prices where truck culture is strongest: Texas, the Mountain West, and the Southeast. California, Oregon, and New York — with their different transportation cultures and higher concentrations of urban buyers — price trucks lower.
Flip strategy: Source trucks from California, Oregon, or New York where truck demand is weaker and prices are lower. Transport to Texas, Georgia, or Colorado where demand is stronger and prices are $4,000–$6,000 higher. The transport cost ($900–$1,400 for cross-country) is easily absorbed by the spread.
The Top Source States for Each Strategy
Based on our data, here is a quick-reference guide for where to source specific vehicle types:
| Vehicle Type | Best Source States | Best Destination States |
|---|---|---|
| Sedans / Crossovers | Michigan, Ohio, Illinois (rust belt) | Florida, California, Texas |
| Trucks (cheap source) | California, Oregon, New York | Texas, Georgia, Colorado |
| Trucks (premium source) | Texas, Georgia (clean, low rust) | Northeast, Pacific Northwest |
| Hybrids / EVs | California (higher supply) | Midwest, Southeast |
| Luxury sedans | Large metros nationally | Suburban markets, South |
| Wranglers / Off-road | Urban coasts (less demand) | Mountain West, Southwest |
How to Actually Execute Interstate Arbitrage
Knowing the spread is step one. Making the deal work requires accounting for all costs.
Transport Costs
Open carrier transport averages $0.50–$0.80 per mile, with a typical minimum of $300–$400 for short hauls. Cross-country routes (e.g., Michigan to Florida, or California to Texas) run $800–$1,400. For the math to work, your state-to-state price spread needs to exceed transport by at least $1,500–$2,000 after accounting for any reconditioning.
Title and Registration
When you buy a vehicle in one state and register/resell in another, title transfer requirements vary. As a licensed dealer, you typically process the title through your home state. As a private individual, you may need to register the vehicle in your home state before selling in another. Understand your state's specific requirements before your first interstate purchase.
Reconditioning for the Destination Market
A Rust Belt Camry brought to Florida needs to pass a buyer's closer inspection of the undercarriage. Budget $300–$800 for detailing, undercoating touch-ups, and any cosmetic work that makes the vehicle competitive with local Sun Belt inventory. Do not try to hide rust — disclose honestly and price accordingly.
CarFlipIQ Multi-State Price Comparison
Our platform shows you side-by-side pricing for any vehicle across all 50 states simultaneously. Find the source-to-destination spread in seconds, backed by 2M+ listings analyzed.
Compare state prices →The States to Watch in 2026
Florida and Texas remain the strongest destination markets for most vehicle types. High population growth, strong economies, and year-round outdoor lifestyle drive consistent used car demand. Prices have not softened significantly despite national trends.
Michigan and Ohio remain the best source markets for clean-title sedans and crossovers. The rust belt discount is structural — it will not disappear — and it consistently creates buying opportunities that are invisible to national pricing tools.
California is counterintuitively cheap on trucks and high on crossovers and sedans. The truck discount in California is significant: F-150s and Silverados list for $3,000–$6,000 less than in Texas or the Southeast. Transport costs make it challenging for individual flippers, but for licensed dealers with transport relationships, the arbitrage is real.
Colorado and Montana have some of the strongest truck markets in the country on a per-capita basis. Outdoor recreation demand keeps prices firm and sell-through fast.
What This Means for Your Buying Strategy
If you are buying a car for personal use: sourcing from a neighboring state's lower-price market can save $2,000–$4,000 on popular models. Factor in one trip or transport cost, and it usually pencils out.
If you are flipping cars for profit: interstate arbitrage is one of the most reliable structural opportunities in the used car market. The price gaps are not closing — they are driven by climate and culture, not temporary supply disruptions. The flippers who build interstate sourcing relationships consistently outperform those who limit themselves to their local market.
The key tool is knowing the actual spread — not what KBB says nationally, but what the same vehicle is actually listed for in your source market and your destination market right now.
See State-by-State Prices for Any Vehicle
CarFlipIQ compares real asking prices across all 50 states in seconds. Find the spread, calculate the margin, and source smarter. Free to start.
Frequently Asked Questions
Which states have the cheapest used cars?
It shifts with supply and demand, but lower-tax, high-inventory states often run cheaper, while tight-supply metros run higher. Check real local sold prices - the gap between states can be thousands on the same car.
Why do used car prices vary by state?
Local supply, demand, climate, taxes, and registration costs all move prices. A car that's cheap in one state can be a bargain to buy and resell elsewhere - which is the whole basis of cross-market flipping.
Can I profit buying a car in one state and selling in another?
Yes, if the price gap covers transport, taxes, and title work. The key is comparing real local resale in both markets - CarFlipIQ tracks prices across all 50 states so you see the spread before you move a car.
How we get these numbers
Market figures come from LocalIQ™, CarFlipIQ's index of asking prices on local used-car listings. We report medians rather than averages, so a few outlier listings can't drag the number, and a model only appears once it has at least 10 listings behind it. Asking prices tell you what the market is asking, not what a car will sell for — treat them as your resale ceiling.
Check the resale before you bid
Look up any year, make and model against LocalIQ™ asking prices in your market. 5 free car analyses, no credit card.