Car Value by ZIP Code: Why Location Changes Everything

In this article (7 sections)
A 2019 Toyota Camry SE with 48,000 miles, clean title, no accidents. In Miami, a private seller lists it at $18,500 and gets multiple inquiries within a day. That same car, same condition, same mileage, sits on Facebook Marketplace in Detroit at $15,200 for two weeks before someone bites.
That is a $3,300 difference for the exact same vehicle. And it is not an outlier. Across our database of 2M+ private market listings spanning all 50 states and metro areas, we see price swings of $2,000 to $5,000 on popular models depending entirely on where the car is located.
If you are buying, selling, or flipping cars for profit, ignoring location data means leaving thousands of dollars on the table.
LocalIQ™ market snapshot
What top flip candidates are asking right now
| Model | Listings | Median asking price |
|---|---|---|
| GMC Sierra 1500 | 523 | $29,995 |
| Chevrolet Silverado 1500 | 1,367 | $25,000 |
| Toyota Tacoma | 1,164 | $27,516 |
| Ford F-150 | 2,592 | $23,995 |
| Ram 1500 | 992 | $22,900 |
| Ford Mustang | 571 | $20,995 |
| Jeep Wrangler | 548 | $25,089 |
| Chevrolet 1500 | 539 | $20,900 |
LocalIQ™ asking-price median · 8,296 listings · updated every 6 hours. National, last 8 model years; asking price is your resale ceiling, not a promised sale price.
Why Car Values Vary by ZIP Code
National pricing tools give you a single number. But the used car market is not national. It is hyper-local. Here are the six forces that push identical vehicles to wildly different price points depending on geography.
Supply and Demand Imbalances
When a metro area has more buyers than sellers for a given vehicle type, prices climb. College towns with large populations of first-time buyers drive up prices on affordable sedans. Retirement communities push up demand for low-mileage, well-maintained SUVs. Rural areas with fewer listings per capita often see higher prices simply because there is less competition.
Regional Vehicle Preferences
Texans buy trucks. Californians buy hybrids and EVs. Northeast commuters buy fuel-efficient sedans. These preferences create structural imbalances. A Ford F-150 in Houston commands a premium because demand is fierce. That same truck in San Francisco sits longer and sells for less because the buyer pool is smaller.
Climate and Condition
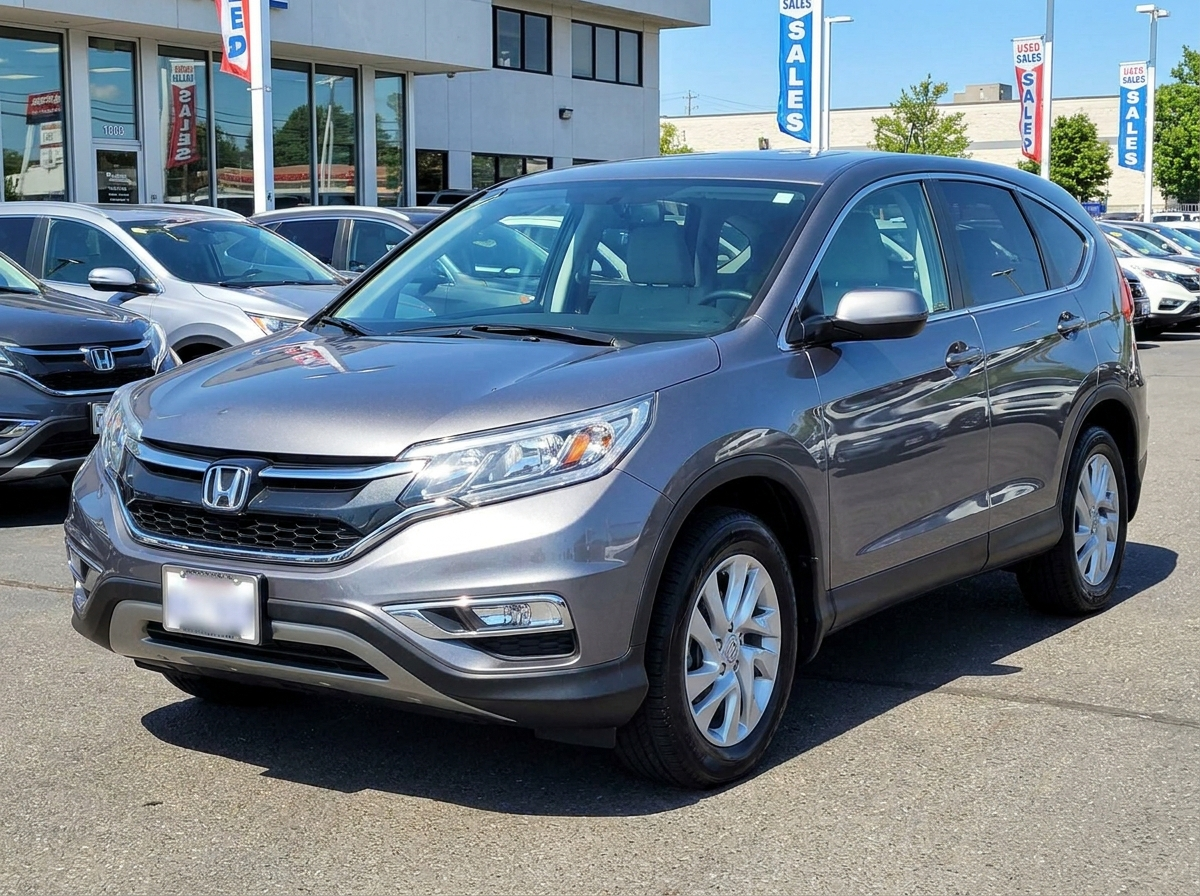
A 2017 Honda CR-V that spent its life in Phoenix has no rust, minimal weather wear, and an intact undercarriage. The same model from Cleveland may have salt damage, corroded brake lines, and faded paint from years of harsh winters. Sun Belt vehicles consistently command higher prices because buyers trust the condition, even sight unseen.
Dealer Density and Competition
Markets saturated with franchise dealers and independent lots push used car prices down through competition. In areas with fewer dealers, private sellers can price higher because buyers have fewer alternatives. Metro areas like Dallas, Atlanta, and Los Angeles have enough dealer inventory to keep prices competitive. Smaller markets do not.
Income Levels and Affordability
Local median income directly affects what buyers are willing and able to pay. A $22,000 SUV might move quickly in a suburb with $95K median household income but sit for weeks in an area where the median is $45K. Sellers in higher-income ZIPs can extract more value from the same vehicle.
State Regulations and Emissions
California, New York, and several other states have strict emissions and inspection requirements that affect which vehicles can be legally registered. A diesel truck that sells easily in Alabama might need thousands in modifications to pass California smog. These regulatory barriers create artificial price floors and ceilings that vary state by state.
See real ZIP-level pricing for any vehicle
Analyze 5 Cars FreeReal Price Differences Across Markets
To illustrate how dramatic these geographic gaps can be, here are four popular models and their average asking prices across different metro areas, pulled from real local market listing patterns.
2019 Toyota Camry SE | 45K-55K miles
The Camry holds strong value in Sun Belt metros where the supply of rust-free examples draws buyers from neighboring states. Detroit's lower price reflects both the local economy and the risk of salt corrosion that buyers factor in, even on clean-title cars.
2020 Ford F-150 XLT 4x4 | 40K-50K miles
The F-150 premium in Texas is a textbook case of regional demand driving prices. Trucks are a lifestyle in Houston. In Portland, where fuel economy and smaller vehicles dominate, the same truck sells for over $5,000 less.
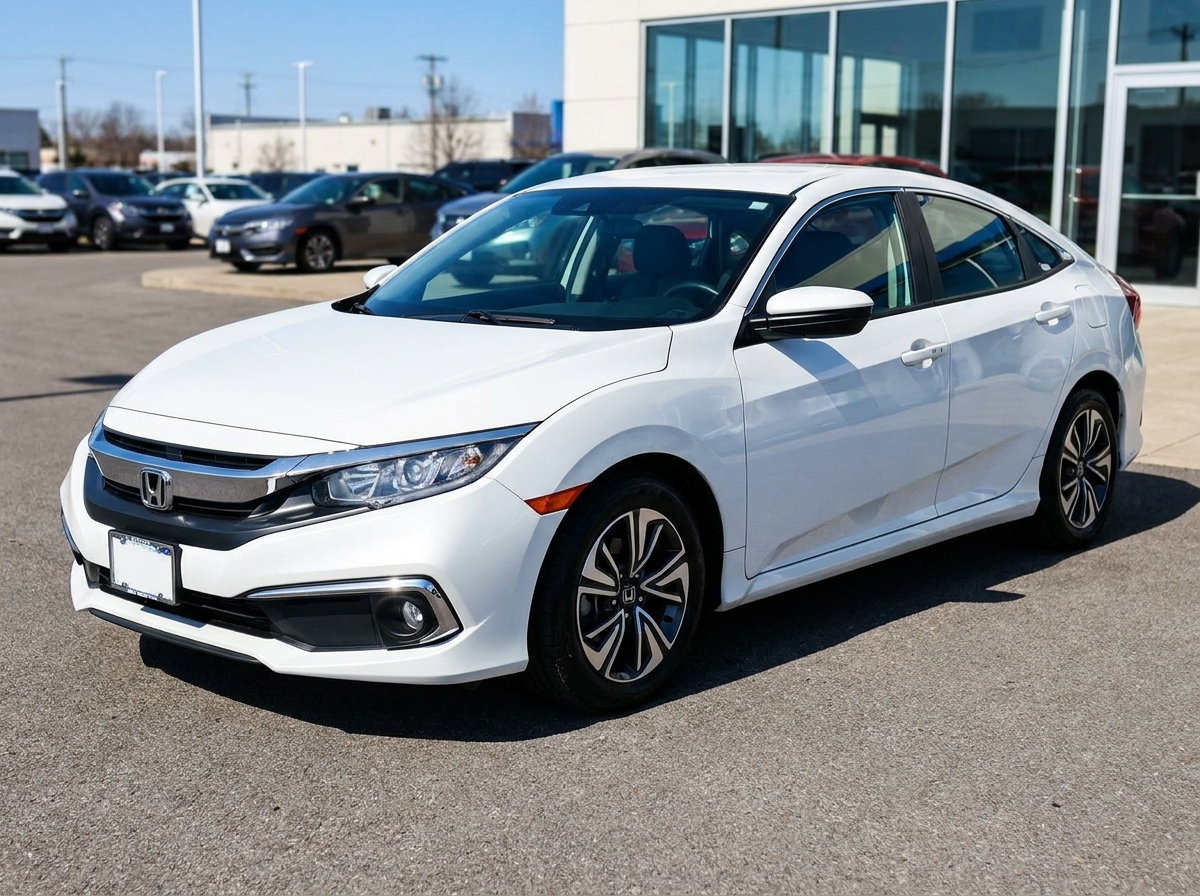
2018 Honda Civic EX | 55K-65K miles
The Civic commands a premium in California where fuel-efficient commuter cars are in high demand and strict emissions compliance narrows the pool of importable alternatives.
2017 Jeep Wrangler Unlimited | 50K-60K miles
Wranglers hold value everywhere, but outdoor-recreation markets like Denver push prices to their ceiling. The gap between Denver and Detroit on this model is nearly $4,800.
How to Exploit Regional Arbitrage
Smart flippers and dealers already know about geographic price gaps. The ones making consistent money have a system for finding and acting on them. Here is the playbook.
Step 1: Identify Low-Cost Source Markets
Look for markets where your target vehicle is common and demand is moderate. Midwestern and Southern cities frequently have lower prices on sedans and crossovers. Rust Belt markets discount trucks and SUVs that show winter wear.
Step 2: Find High-Demand Destination Markets
Sun Belt metros, coastal cities, and markets with strong economies are where you sell. A clean-title Camry from Ohio gains $2,000 to $3,000 in value just by listing it in South Florida. Trucks purchased in the Southeast can be resold at a premium in Texas or Colorado.
Step 3: Factor in Transport Costs
Open carrier transport between most US cities runs $500 to $1,200 depending on distance. For arbitrage to work, your price gap needs to exceed transport plus any reconditioning costs. A $3,300 spread on the Camry example above still nets $1,800 to $2,500 after transport.
Step 4: Validate With Real Data
This is where most people fail. They rely on national valuation tools that miss local pricing entirely. You need actual asking prices from the specific ZIP codes you are sourcing from and selling into.
CarFlipIQ Regional Arbitrage Scanner
Our arbitrage tools compare real asking prices across 50+ metro areas automatically. Find vehicles priced below market in one region and see what they sell for in your local market, backed by 2M+ listings analyzed.
Explore arbitrage tools →Why KBB and National Tools Miss This
Kelley Blue Book, Edmunds, and NADA provide national averages. They are useful as a starting point, but they are not designed to capture ZIP-level pricing reality. Here is what they miss.
Aggregation hides the spread. When KBB says a 2019 Camry is worth $16,800, they are blending Detroit's $15,200 with Miami's $18,500 into a single number. That average helps no one who is actually buying or selling in either market.
Dealer-weighted data skews high. Most national tools lean heavily on dealer asking prices and auction results. Facebook Marketplace, where private sellers set prices based on local competition, tells a different story, often $1,000 to $2,000 lower than dealer-focused estimates.
Static updates lag the market. National tools update values on monthly or quarterly cycles. The used car market in any given ZIP code can shift meaningfully in a week based on new inventory, seasonal demand, or local economic changes.
No private-sale coverage. The private-party market on Facebook Marketplace is the largest peer-to-peer vehicle marketplace in the US, and it is barely represented in traditional valuation tools. If you are buying or selling privately, you need private-sale data.
We covered this in depth in our analysis of whether KBB is actually accurate for real-world transactions.
Stop guessing. See real local prices for cars in your ZIP.
Get Real Pricing DataHow CarFlipIQ Delivers ZIP-Level Pricing
CarFlipIQ was built specifically to solve the local pricing problem. Here is how our system works.
Proprietary Private Market Intelligence
We continuously aggregate listing data from private markets across all 50 US states and major metro areas. Our database contains 2M+ vehicle listings analyzed with real asking prices, seller history, days on market, and price changes, all indexed by location down to the metro level.
See coverage maps →Real Listings, Real Prices
Every data point in CarFlipIQ comes from an actual local market listing. We track asking prices, price drops, days on market, and whether a listing was marked as sold. This gives you ground-truth pricing that reflects what real buyers are actually willing to pay in a specific area.
Multi-Market Comparison
Search for any year, make, and model and instantly see how prices compare across metros. Our platform shows you where the same vehicle is cheapest and where it commands a premium, making arbitrage opportunities visible at a glance.
Seller Intelligence
We track seller patterns across our database. Know whether you are buying from a casual private seller or a high-volume flipper who prices aggressively. Seller behavior affects pricing, and we surface that context so you can negotiate smarter.
Days on Market Analytics
A vehicle priced at $17,000 in Phoenix means something different if it has been listed for 3 days versus 45 days. Our days-on-market tracking helps you identify motivated sellers and stale inventory where there is room to negotiate.
Practical Tips for Using Location Data
Whether you are a first-time buyer, a seasoned flipper, or a small dealer, here is how to put ZIP-level pricing to work.
Always check your local market first. Before accepting any national estimate, look at what the same vehicle is actually listed for within a 50-mile radius of your ZIP code. That is your real market.
Compare at least three metros. If you are considering buying from out of state, compare pricing in at least three different metro areas. The cheapest market is not always the best deal once you factor in transport and condition risk.
Watch for seasonal patterns. Convertibles drop in price in northern states during fall. Trucks spike in spring when landscaping and construction season ramp up. Timing your purchase to a market's off-season can save $1,000 or more.
Factor in reconditioning. A vehicle from a northern state may need undercoating, brake work, or cosmetic repair to match Sun Belt condition standards. Budget $500 to $1,500 for reconditioning when sourcing from Rust Belt markets.
Track price trends over time. A vehicle that has dropped $800 in the last two weeks may drop another $500 if you wait. CarFlipIQ tracks price history so you can see whether a listing is trending down or holding firm.
Use data for negotiation. When you can show a seller that identical vehicles in nearby markets are listed for less, you have leverage. Data-backed offers get accepted more often than gut-feel lowballs.
The Bottom Line
The used car market is not one market. It is thousands of micro-markets, each with its own supply, demand, preferences, and pricing dynamics. A car's value is inseparable from its location.
National tools give you a rough average. ZIP-level data gives you an edge.
Whether you are trying to get a fair price on your next purchase, flip cars profitably, or find auction arbitrage deals, understanding how location affects value is the single most important skill you can develop.
CarFlipIQ puts 2M+ real listings analyzed at your fingertips, organized by location, priced by actual market activity, and updated continuously. Stop relying on national averages that do not reflect your market.
See what any car is worth in your ZIP code
Get instant access to real local market pricing data across all 50 states. Compare markets, find arbitrage, and make smarter deals.
Frequently Asked Questions
Why do car values change by ZIP code?
Local supply and demand. The same year/make/model can sell for thousands more in one metro than another based on climate, commute patterns, and how many comparable cars are listed nearby. A national average hides that gap.
How do I find a car's value in my area?
Look at real local listing prices for that exact year/make/model in your ZIP, not a national estimate. CarFlipIQ tracks 2M+ local listings across all 50 states so you price against your actual market.
Is a national car value estimate accurate?
Only as a rough midpoint. Real local listing prices swing widely by location, so a national figure can be off by thousands either way - which is exactly how flippers overpay or underprice.
How we get these numbers
Market figures come from LocalIQ™, CarFlipIQ's index of asking prices on local used-car listings. We report medians rather than averages, so a few outlier listings can't drag the number, and a model only appears once it has at least 10 listings behind it. Asking prices tell you what the market is asking, not what a car will sell for — treat them as your resale ceiling.
Check the resale before you bid
Look up any year, make and model against LocalIQ™ asking prices in your market. 5 free car analyses, no credit card.