Same Car, Different Price: Used-Car Prices and Days-to-Sell by State (Q3 2026 Data Study)
Quick answer
We matched 213,571 Q3 2026 listings on make, model, model year and mileage band. On that like-for-like basis, Florida asks 13.3% below the national price for the same car (n=13,866) and Idaho asks 11.5% above it (n=3,705). Raw state medians exaggerate the gap: Rhode Island versus South Dakota reads as 2.5x unmatched but is about 15% matched. Among the 40 highest-volume models, the Toyota 4Runner sold fastest at an average of 9.9 days (n=237). Every figure is an asking price, not a sale price.
In this article (7 sections)
This is CarFlipIQ's first quarterly data study. It was built for anyone who buys at Copart, IAAI, Manheim or a public auction and resells retail. The question it answers: where does the same car ask the most and least, and which cars move fastest once listed?
We tracked 255,458 clean-title used-car listings observed between July 1 and September 30, 2026. 133,064 of them sold, and they span all 50 states and DC. Every number below carries its sample size, and any group under 10 listings is suppressed.
LocalIQ™ market snapshot
What top flip candidates are asking right now
| Model | Listings | Median asking price |
|---|---|---|
| GMC Sierra 1500 | 523 | $29,995 |
| Chevrolet Silverado 1500 | 1,367 | $25,000 |
| Toyota Tacoma | 1,164 | $27,516 |
| Ford F-150 | 2,592 | $23,995 |
| Ram 1500 | 992 | $22,900 |
| Ford Mustang | 571 | $20,995 |
| Jeep Wrangler | 548 | $25,089 |
| Chevrolet 1500 | 539 | $20,900 |
LocalIQ™ asking-price median · 8,296 listings · updated every 6 hours. National, last 8 model years; asking price is your resale ceiling, not a promised sale price.
Key findings
- Florida is the cheapest place to source the same car. Matched on model, year and mileage band, Florida asks 13.3% below the national price (index 0.867, n=13,866).
- Idaho is the priciest. The same car asks 11.5% above national (index 1.115, n=3,705). Florida-to-Idaho is a 29% spread on the like-for-like car.
- Raw state medians exaggerate the gap. South Dakota's raw median is $12,500 (n=1,875) and Rhode Island's is $5,000 (n=894), a 2.5x gap. Matched for the car, it is about 15%.
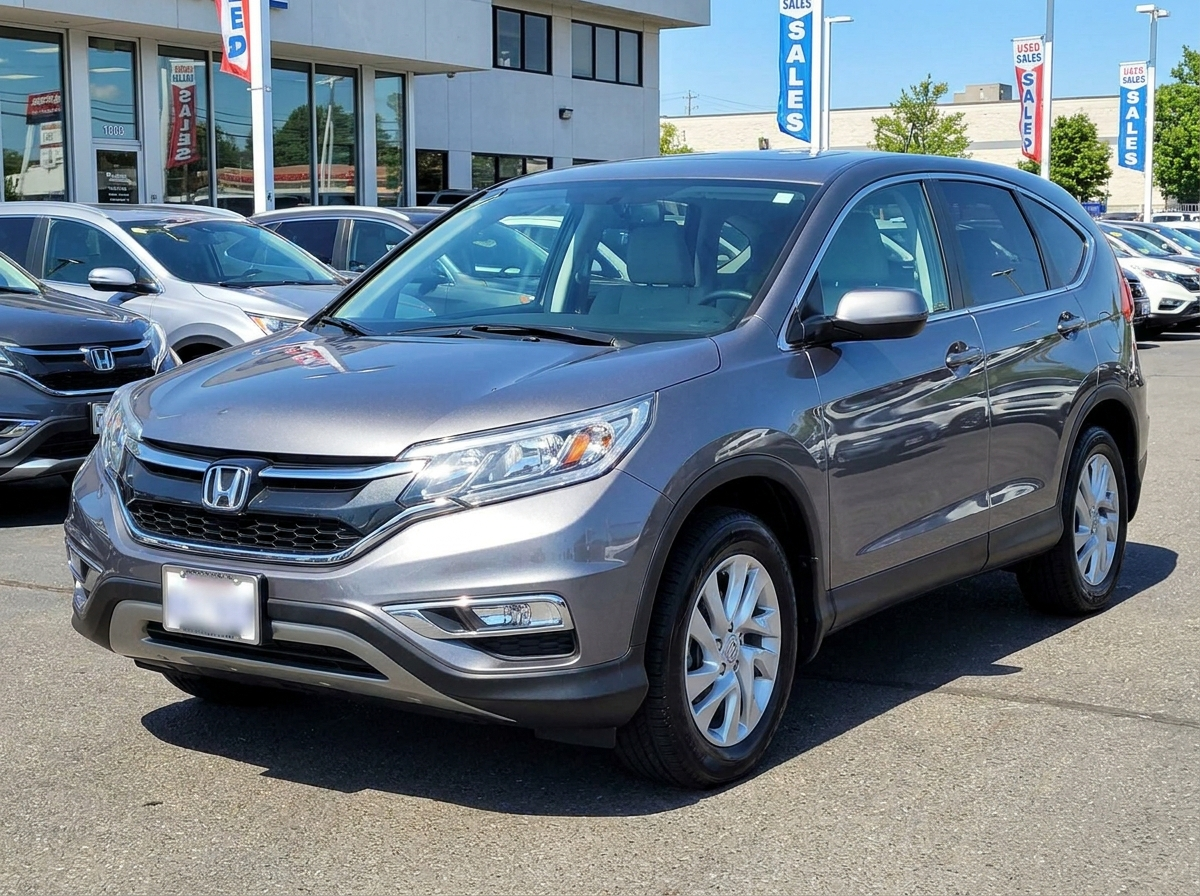
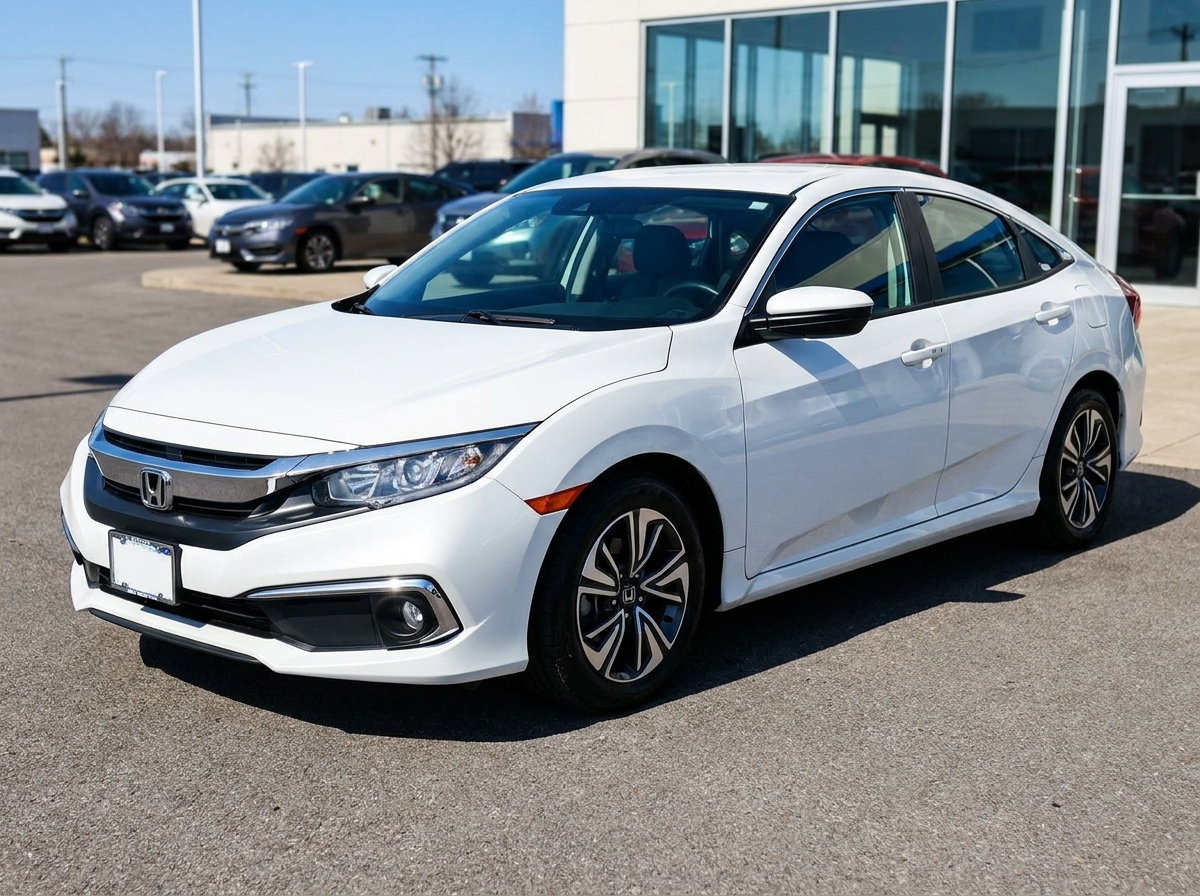
- A 2017 Honda Civic asks $9,700 in Florida (n=82) and $14,995 in Oregon (n=35). The national median is $12,000 (n=1,208).
- The Toyota 4Runner sold fastest of the 40 highest-volume models: 9.9 days on average (n=237 timed sales). Timing is the hard part. 81.3% of sold listings (n=133,064) were visible for under 3 days, too short for our crawl to time, so days-to-sell is measured on the 34,581 we saw across multiple crawls.
What this data is: asking prices of marketplace listings, not transaction prices. "Sold" means the listing came down and stayed down. Read the methodology before quoting a number.
Where the same car is cheapest and priciest
The index compares each listing with the national median for its own cell: same make, same model, same model year, same mileage band. The bands are under 60k, 60–100k, 100–150k and 150k+ miles. An index of 1.00 is the national price for that exact car, and 0.90 is 10% under it. Only cells with at least 10 listings nationally count.
We show states with at least 1,000 matched listings. The full 51-row table, including smaller states, is in the CSV download.
Cheapest 10 (same car, like-for-like)
| # | State | Matched index | vs. national | Raw median ask | Listings (n) |
|---|---|---|---|---|---|
| 1 | Florida | 0.867 | −13.3% | $6,990 | 13,866 |
| 2 | Maryland | 0.918 | −8.2% | $6,400 | 1,884 |
| 3 | Texas | 0.922 | −7.8% | $6,500 | 9,333 |
| 4 | Connecticut | 0.939 | −6.1% | $5,000 | 2,542 |
| 5 | New Jersey | 0.941 | −5.9% | $6,995 | 4,013 |
| 6 | Pennsylvania | 0.944 | −5.6% | $6,400 | 3,085 |
| 7 | New York | 0.945 | −5.5% | $6,500 | 6,299 |
| 8 | Michigan | 0.957 | −4.3% | $6,500 | 4,424 |
| 9 | Tennessee | 0.969 | −3.1% | $6,500 | 3,163 |
| 10 | California | 0.981 | −1.9% | $6,900 | 10,381 |
Priciest 10 (same car, like-for-like)
| # | State | Matched index | vs. national | Raw median ask | Listings (n) |
|---|---|---|---|---|---|
| 1 | Idaho | 1.115 | +11.5% | $11,000 | 3,705 |
| 2 | Alaska | 1.103 | +10.3% | $10,000 | 2,683 |
| 3 | Montana | 1.100 | +10.0% | $8,950 | 1,351 |
| 4 | South Dakota | 1.097 | +9.7% | $12,500 | 1,875 |
| 5 | Iowa | 1.075 | +7.5% | $9,995 | 3,012 |
| 6 | Kansas | 1.067 | +6.7% | $8,300 | 1,877 |
| 7 | Oregon | 1.067 | +6.7% | $8,800 | 7,463 |
| 8 | Washington | 1.059 | +5.9% | $8,000 | 5,934 |
| 9 | Mississippi | 1.055 | +5.5% | $9,000 | 3,061 |
| 10 | Missouri | 1.055 | +5.5% | $8,470 | 5,514 |
Compare the two columns. Connecticut's raw median is $5,000, the lowest in the table. Matched for the car, it lands 6.1% under national, well behind Florida. Utah's raw median is $11,500, but matched it is only 2.1% over national. Most of a raw median reflects which cars a state lists. The matched index isolates the part that is actually about the state.
That also corrects our own June post, Cheapest States to Flip Cars in 2026. It ranked states on unmatched medians. The direction mostly holds. The size of the gaps does not.
The same car, same model year, by state
Four high-volume cars, each at one model year. These medians are year-matched but not mileage-matched, so a state full of high-mile examples will read low. Only states with at least 20 listings from at least 5 different sellers are shown.
| Car | National median (n) | Lowest-asking state (n) | Highest-asking state (n) | High vs. low |
|---|---|---|---|---|
| 2017 Honda Civic | $12,000 (1,208) | Florida $9,700 (82) | Oregon $14,995 (35) | +55% |
| 2015 Ford F-150 | $14,000 (553) | Illinois $10,900 (21) | Utah $17,323 (30) | +59% |
| 2017 Toyota Camry | $10,000 (548) | New York $8,200 (24) | Utah $11,500 (24) | +40% |
| 2016 Honda Accord | $9,879 (667) | Florida $7,900 (55) | Illinois $10,597 (20) | +34% |
About Oregon's $14,995. At a 10-listing threshold, Oregon's median landed on exactly $14,995 for three different cars. That is a common price point, and it looked like a single dealer. So this table requires 20 listings from at least 5 different sellers per state. Oregon's 35 Civic listings come from 34 sellers, so that figure stands. The Camry and Accord cells dropped out. The 2018 Chevrolet Equinox was also in the study. Only one state cleared the bar, so it is left out here.
If you buy at auction to resell, read this table in the right order. Look up the retail ask where you will sell first, then work backward to a bid. The max bid calculator does that math, and the Copart fee calculator and IAAI fee calculator show what the buyer fees add to the hammer price. Model pages carry the live numbers: Honda Civic, Toyota Camry, Honda Accord.
Which high-volume models sold fastest
Days-to-sell is the average time between the first and last time we saw a listing, over listings that sold. We only count listings seen on at least two different crawls. The table ranks the 40 models with the most sales in Q3.
Read the last column alongside the days figure. It is the share of all that model's sold listings that our crawl saw for under 3 days, too short to time. It is not a share sold within 3 days, because the car may have come down days after our last look. A high share means the average is computed on the minority we could watch. The "vs. state average" column divides each sale by the average for its own state. That controls for states where we crawl more or less often, and 1.00 means typical for where it was listed.
Fastest 10
| # | Model | Avg days to sell | Timed sales (n) | vs. state average | Seen < 3 days | All sales (n) |
|---|---|---|---|---|---|---|
| 1 | Toyota 4Runner | 9.9 | 237 | 0.74 | 83.7% | 903 |
| 2 | Jeep Grand Cherokee | 10.9 | 212 | 0.75 | 84.3% | 897 |
| 3 | Toyota Tundra | 10.9 | 240 | 0.76 | 82.6% | 946 |
| 4 | Hyundai Sonata | 11.4 | 259 | 0.90 | 86.7% | 1,226 |
| 5 | Volkswagen Jetta | 11.5 | 311 | 0.86 | 82.8% | 1,158 |
| 6 | Hyundai Elantra | 11.7 | 414 | 0.99 | 83.5% | 1,621 |
| 7 | Nissan Rogue | 11.9 | 285 | 0.92 | 84.2% | 1,151 |
| 8 | Nissan Sentra | 12.0 | 251 | 0.89 | 84.3% | 1,108 |
| 9 | Subaru Outback | 12.2 | 224 | 0.79 | 82.7% | 881 |
| 10 | Jeep Wrangler | 12.3 | 274 | 0.78 | 84.5% | 1,114 |
Slowest 5 of the 40
| Model | Avg days to sell | Timed sales (n) | vs. state average | Seen < 3 days | All sales (n) |
|---|---|---|---|---|---|
| Chevrolet Malibu | 19.3 | 154 | 1.27 | 86.6% | 811 |
| Honda Civic | 17.9 | 2,780 | 1.48 | 75.1% | 8,556 |
| Honda Accord | 16.2 | 1,856 | 1.34 | 78.2% | 6,514 |
| Ram 1500 | 15.6 | 429 | 0.93 | 81.8% | 1,704 |
| Chevrolet Equinox | 15.0 | 221 | 1.14 | 86.4% | 1,163 |
Spelling variants are merged for these rankings: F150 into F-150, Dodge Ram 1500 into Ram 1500, and Chevrolet "1500" into Silverado 1500. Chevrolet listings titled only "Silverado" stay separate because they may include 2500s.
Civic and Accord post the slowest times among the biggest sellers. They are the two most-listed cars in the study, with 8,556 and 6,514 sales. They also have among the lowest shares seen for under 3 days (75.1% and 78.2%). The Civic sold more units than any other model. A likely reason its average sits high: thousands of sellers compete for the same buyer, and more of those listings stay up long enough for us to time. Reading "slow" as "hard to sell" gets this backwards. Volume and speed are separate questions, and you want both answered for your own market.
Fastest model within each state
Crawl frequency differs by region, so we do not rank states against each other on days-to-sell. The state averages below run from 5.5 days (Florida) to 19.4 (Alaska). That spread reflects how often we check each region as much as how fast cars sell. Within one state, every model gets the same crawl, so ranking models inside a state is fair.
This table covers states with at least 1,000 timed sales. It shows the model with the lowest average days-to-sell among models with at least 30 timed sales there.
| State | Fastest model | Avg days (n) | State average days (n) |
|---|---|---|---|
| Florida | Chevrolet Silverado 1500 | 2.7 (41) | 5.5 (2,502) |
| North Carolina | Nissan Altima | 7.0 (42) | 12.0 (2,312) |
| Arizona | Ram 1500 | 6.0 (41) | 8.4 (2,034) |
| Illinois | Toyota Corolla | 7.8 (90) | 9.9 (1,808) |
| Utah | Chevrolet Silverado 1500 | 4.8 (39) | 8.3 (1,795) |
| Oregon | Ford F-150 | 7.6 (59) | 12.3 (1,647) |
| Alaska | Ford Escape | 16.7 (32) | 19.4 (1,466) |
| Colorado | Subaru Outback | 9.1 (30) | 13.3 (1,460) |
| Wisconsin | Chevrolet Silverado 1500 | 5.6 (37) | 9.8 (1,402) |
| Massachusetts | Toyota Camry | 7.9 (49) | 9.1 (1,094) |
| California | Toyota Camry | 7.6 (54) | 7.6 (1,029) |
| Washington | Ford F-150 | 12.7 (36) | 16.1 (1,003) |
Full-size pickups are the fastest high-volume model in half of these states. The Silverado 1500 leads in Florida, Utah and Wisconsin, the F-150 in Oregon and Washington, and the Ram 1500 in Arizona. Utah is also the highest-asking state for a 2015 F-150 ($17,323, n=30). A truck that asks well and moves fast in your market is worth a second look before a bid.
What this means before you bid
- Price the resale where you will sell, matched for the car. A 13% state discount on the like-for-like car is real. It is also smaller than a raw-median table suggests, and transport and your home-state tax come out of it. The vehicle sales tax calculator covers the tax side.
- Speed is local. The fastest car in Florida is not the fastest car in North Carolina. Check days-to-sell in your own market, not a national list.
- Volume is not speed. Civic and Accord are the easiest cars to source and resell. They are not the fastest to resell, because you are competing with thousands of other sellers.
Methodology
Source. CarFlipIQ's listings dataset: private-party and dealer used-car listings on online marketplaces, crawled across 59 scrape zones nationwide.
Window. Listings last observed from July 1 to September 30, 2026. Sold events in the data run from July 15 to September 16. Our crawler recorded no sold events before July 15, none August 3–16, and none after September 16, so Q3 here means roughly seven weeks of sold observations, not thirteen.
Pool (255,458 listings, 133,064 sold). Status active or sold. Repost rows that a later listing superseded are excluded. Asking price is $1,000–$100,000, outlier-filtered. The listing is classified clean-title by our production title rules, and it has a known model year, model and mileage. Prices are the last asking price, not a transaction price. A listing counts as sold when it stops appearing in our crawl and does not return.
Price index (213,571 listings). Cell = make × model × model year × mileage band (under 60k / 60–100k / 100–150k / 150k+). A cell counts only with at least 10 listings nationally. Each listing's price is divided by its cell's national median. A state's index is the median of those ratios, using PERCENTILE_CONT(0.5) for all medians. States with fewer than 10 matched listings are suppressed. The tables above show states with at least 1,000.
Days-to-sell. The average of (last seen − first seen) over sold listings with last seen after first seen. In Q3 that is 34,581 of 133,064 sold listings, averaging 13.8 days. Caveats:
- We only record a date when we crawl, so last seen partly reflects how often we check a region, not the exact day a car sold.
- A listing counts as sold after it has been missing for about 3 days. A listing we saw for under 3 days is below our resolution. That is why every average comes with the share seen for under 3 days. It is not a share sold within 3 days.
- A seller who deletes and reposts a car restarts first seen, which understates days on market for reposted cars.
- For these reasons we do not compare days-to-sell between states.
Minimum samples. Every reported group has n ≥ 10. The same-car table uses n ≥ 20 from at least 5 distinct sellers per state. The per-state fastest-model table uses n ≥ 30 per model and at least 1,000 timed sales per state.
Reproducibility. Every number here comes from one read-only script, scripts/studies/q3_2026_study.py, in the CarFlipIQ repository. It holds the exact SQL. The state index is available as a CSV (50 states and DC). This study does not include auction hammer prices. We report retail asking prices only.
See the matched price for your car, in your market.
CarFlipIQ shows local asking prices and days-to-sell for any year, make and model. 5 free car analyses, no credit card.
Frequently Asked Questions
Which state has the cheapest used cars for the same model, year and mileage?
In Q3 2026, Florida. Matched on make, model, model year and mileage band, Florida listings asked a median 13.3% below the national price for the same car (index 0.867, n=13,866 listings). Maryland (0.918, n=1,884) and Texas (0.922, n=9,333) came next among states with at least 1,000 matched listings.
Which state has the most expensive used cars for the same car?
Idaho. Its listings asked a median 11.5% above the national price for the same model, year and mileage band (index 1.115, n=3,705). Alaska (1.103, n=2,683), Montana (1.100, n=1,351) and South Dakota (1.097, n=1,875) followed.
Why do raw state price medians mislead?
Different states list different cars. South Dakota's raw median asking price was $12,500 and Rhode Island's was $5,000, which looks like a 2.5x gap. Much of that is newer, pricier cars in one state and older ones in the other. After matching on model, year and mileage band, the gap is about 15% (index 1.097 against 0.953).
How fast do used cars sell?
Of the 133,064 clean-title listings that sold in Q3 2026, 81.3% were visible to our crawl for under 3 days, too short for us to time. That does not mean they sold within 3 days. The 34,581 sold listings we saw on at least two different crawls averaged 13.8 days from first to last sighting. Among the 40 highest-volume models, the Toyota 4Runner (9.9 days, n=237), Jeep Grand Cherokee (10.9, n=212) and Toyota Tundra (10.9, n=240) were fastest.
Are these sale prices?
No. Every price in this study is the last asking price of a private-party or dealer listing. We do not see transaction prices. A listing counts as sold when it stops appearing in our crawl and does not come back.
How we get these numbers
Market figures come from LocalIQ™, CarFlipIQ's index of asking prices on local used-car listings. We report medians rather than averages, so a few outlier listings can't drag the number, and a model only appears once it has at least 10 listings behind it. Asking prices tell you what the market is asking, not what a car will sell for — treat them as your resale ceiling.
Check the resale before you bid
Look up any year, make and model against LocalIQ™ asking prices in your market. 5 free car analyses, no credit card.