Fastest Selling Used Cars for Flippers (Real DOM Data, 2026)
Quick answer
The fastest-selling used cars are reliable, in-demand mainstream models with low days-on-market in your specific metro — not a national 'fast sellers' list. Sell-speed matters more than margin, because annual return depends on how often your capital recycles.
In this article (8 sections)
The most profitable flipper is not the one with the highest per-car margin. It is the one with the fastest cycle time. A $1,500 profit on a 10-day flip equates to a higher annualized return than a $3,000 profit on a 45-day flip.
This guide ranks the fastest-selling used cars in 2026 by median days-on-market from 463K+ active Facebook Marketplace listings (as of writing) across all 50 states. Velocity matters more than headline margin if you want to compound capital.
For live local velocity data on any model, check CarFlipIQ.
LocalIQ™ market snapshot
What top flip candidates are asking right now
| Model | Listings | Median asking price |
|---|---|---|
| GMC Sierra 1500 | 523 | $29,995 |
| Chevrolet Silverado 1500 | 1,367 | $25,000 |
| Toyota Tacoma | 1,164 | $27,516 |
| Ford F-150 | 2,592 | $23,995 |
| Ram 1500 | 992 | $22,900 |
| Ford Mustang | 571 | $20,995 |
| Jeep Wrangler | 548 | $25,089 |
| Chevrolet 1500 | 539 | $20,900 |
LocalIQ™ asking-price median · 8,296 listings · updated every 6 hours. National, last 8 model years; asking price is your resale ceiling, not a promised sale price.
Why Velocity Matters More Than Margin
Two flippers, both with $50,000 of working capital:
Flipper A: 8 turns per year at $3,000 margin per turn = $24,000 annual gross. Flipper B: 24 turns per year at $1,500 margin per turn = $36,000 annual gross.
Same capital. Different velocity. Flipper B makes 50% more despite earning half the per-car margin.
The catch: Flipper B needs sustained demand to maintain 24 turns. Volatile or thin markets cannot support that velocity. The list below identifies vehicles with depth of demand that supports fast cycles in most US markets.
The Top 10 Fastest-Selling Models
Ranked by national median days-on-market at fair retail pricing.
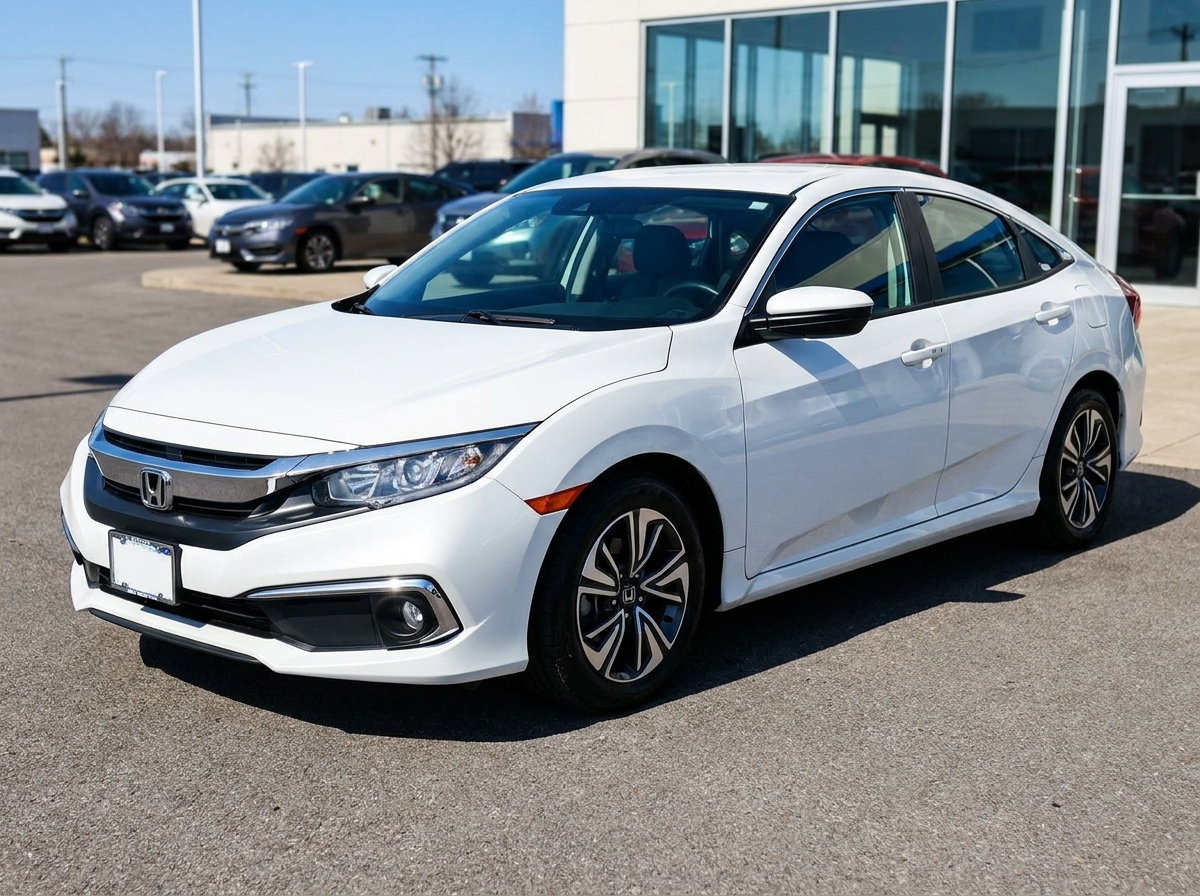
1. Honda Civic (2018-2022) — Median DOM: 8-12 days
The Civic is the king of fast turnover. First-time buyers, college students, commuters, and budget-conscious shoppers all converge on it. National financing acceptance is nearly universal — every credit union, every bank, every subprime lender will write Civic paper.
Best variants: LX and EX trims, 4-door sedan, gas (not hybrid for this segment).
2. Toyota Camry (2017-2021) — Median DOM: 10-14 days
The Civic's larger sibling. Slightly slower but with bigger per-car margins. Camry's reputation moves cars even with cosmetic compromises that would slow down a Cruze or Fusion.
Best variants: LE and SE trims, 4-cyl gas engine.
3. Toyota Corolla (2017-2021) — Median DOM: 10-15 days
Slightly slower than the Civic and Camry but with very tight asking-to-sold spreads. Buyers know the price and pay it.
Best variants: LE and SE.
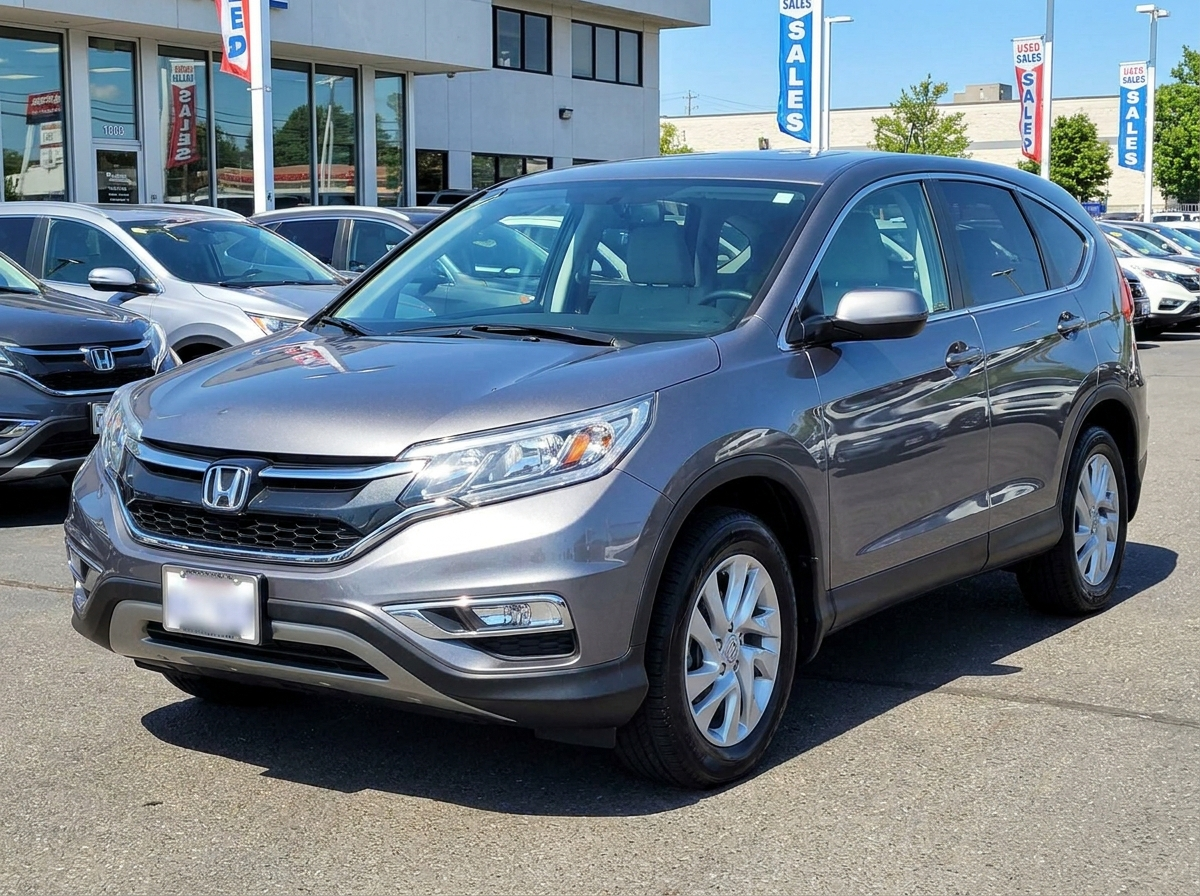
4. Honda CR-V (2018-2021) — Median DOM: 12-18 days
Fastest-selling compact SUV. SUV demand premium adds margin; CR-V reliability rep adds velocity.
Best variants: EX and EX-L trims with gas engine. Avoid 1.5T oil-dilution issues for cold-weather markets.
5. Toyota RAV4 (2017-2021) — Median DOM: 14-20 days
Close cousin to CR-V. RAV4 commands slight pricing premium. Slightly slower velocity in some markets because of the higher asking price band.
Best variants: LE and XLE gas trims.
6. Honda Accord (2018-2022) — Median DOM: 14-20 days
Slower than Civic and Camry but with stronger per-car margins. Accord's mid-size segment competes with Camry directly.
Best variants: Sport and EX trims.
7. Toyota Tacoma (2018-2022) — Median DOM: 16-25 days
Slow for a high-velocity list, but pickup demand is robust enough that Tacomas reliably move within a month. Margins are 2x compact sedans.
Best variants: SR5 and TRD Off-Road, 4WD.
8. Subaru Outback (2018-2022) — Median DOM: 12-18 days IN TARGET MARKETS
Velocity collapses outside the Pacific Northwest, Mountain West, and New England. In target markets, Outbacks fly. In Texas or Florida, they sit.
9. Hyundai Elantra (2018-2022) — Median DOM: 12-18 days
Budget alternative to Civic and Corolla. Younger buyer pool tolerates the brand. Subprime financing is easier than for some Korean alternatives.
Best variants: SE and SEL.
10. Toyota Highlander (2018-2021) — Median DOM: 15-22 days
Family-SUV demand is strong nationally. Slightly higher acquisition cost compresses margin per turn but velocity is consistent.
Models That Look Fast But Slow Down Outside Major Markets
Three deceiving picks:
Tesla Model 3 / Model Y
National data suggests fast turn. Local data tells a different story — Tesla velocity is concentrated in urban California, Texas, Florida, and Pacific Northwest. In rural Midwest or South, Teslas sit 40+ days.
Jeep Wrangler
Looks like a fast turn until you realize the buyer pool is regional and cyclical. Spring and summer see fast cycles; winter sees 60-day inventory.
Ford Mustang / Chevrolet Camaro
Demand is real but concentrated in specific demographics and regions. Outside those bands, performance cars sit.
For all three, check local DOM before bidding. National medians lie.
The Velocity-First Pricing Strategy
To actually achieve the median DOMs above, price slightly below local median sold price. The pricing tiers:
Aggressive velocity (lower margin, fastest turn)
List 5% below local median sold. Targets the 5th-25th percentile buyer pool. DOM 30-50% below median.
Market velocity (balanced)
List at local median. Standard approach. DOM matches the list above.
Premium positioning (higher margin, slower turn)
List 5% above median. Targets the patient buyer who values your specific listing. DOM 30-60% above median.
Pick one and commit. The flippers who switch mid-listing (start at premium, drop to median, then below median) end up with the worst of both — slow turn AND damaged buyer perception.
See real DOM for any model in your market.
Analyze 5 Cars FreeHow to Maintain Velocity
Five tactics that compress DOM regardless of model:
1. Professional photos
Daytime, even lighting, clean car, 12-15 photo minimum. Phone photos taken at dusk in a driveway lose 30% of buyer attention. Worth $50-$100 to hire a local professional if you do volume.
2. Honest, detailed listing copy
Disclose flaws upfront. Buyers who arrive to see undisclosed issues walk and leave bad reviews. Buyers who arrive prepared for the disclosed flaws often close.
3. Fast response to inquiries
The buyer who messages at 9 AM and gets a reply by 9:15 closes 40-50% of the time. The buyer who messages at 9 AM and gets a reply at 6 PM closes 12-18%. Same lead. Different velocity.
4. Saturday/Sunday viewing windows
Most cash buyers shop weekends. Listings that offer flexible weekend viewings move faster than weekday-only.
5. Listing on multiple platforms
Facebook Marketplace primary. Craigslist secondary (still works in many markets). OfferUp tertiary. Cross-listing doubles inquiry volume in most markets.
What Slows Velocity
Five things that consistently push DOM 50-100% above median:
1. Asking price 10%+ above market
Buyers do price research. Listings above market get scrolled past.
2. Bad or insufficient photos
Three blurry photos taken at night in a parking lot kills inquiry volume.
3. Vague listing copy
"Runs great. No issues." with no other detail signals hidden problems. Buyers assume the worst.
4. Branded titles without acknowledgment
Hiding a rebuilt title until the buyer arrives wastes both parties' time and triggers bad-faith feedback.
5. Unresponsive seller
Most leads die in the first 24 hours of silence.
The Tradeoff: Velocity vs Margin
For any given model, you can choose either velocity or margin — rarely both. Pricing 3-5% below median trades $300-$500 in per-car margin for 30-50% faster DOM. That trade is usually positive for volume operators and negative for one-off flippers.
Run the math on your specific portfolio:
Annualized ROI = (Margin × Turns per year) / (Average capital deployed)
If margin × turns improves, take it. If margin improves but turns drop by more, do not.
Bottom Line
The fastest-selling used cars in 2026 are Honda Civic, Toyota Camry, Toyota Corolla, Honda CR-V, Toyota RAV4, Honda Accord, Toyota Tacoma, Subaru Outback (in target markets), Hyundai Elantra, and Toyota Highlander. These have the demand depth to support 8-20 day cycles in most US markets.
Pricing slightly below local median plus disciplined sales hygiene (good photos, fast response, weekend availability) compresses your DOM further. Verify your local velocity with CarFlipIQ before bidding — national medians are starting points, not destinations.
See best cars to flip 2026 for the margin-ranked list and best cars under $10K for the budget-segment ranking.
Velocity is local. So is the data that proves it.
CarFlipIQ tracks DOM by model and ZIP across all 50 states. Stop guessing. Start measuring.
Frequently Asked Questions
Which used cars sell the fastest?
Reliable, in-demand mainstream models with low days-on-market in your specific metro. National 'fast sellers' lists miss local reality - a model that flies in one city can stall in another.
Why does sell-speed matter more than margin?
Because annual return = margin times how many times your capital recycles per year. A fast-selling car at a smaller margin almost always out-earns a slow one at a bigger margin.
How do I know how fast a car sells in my area?
Track real days-on-market for that year/make/model in your ZIP. CarFlipIQ measures this across 2M+ listings so you're not guessing from a national average.
How we get these numbers
Market figures come from LocalIQ™, CarFlipIQ's index of asking prices on local used-car listings. We report medians rather than averages, so a few outlier listings can't drag the number, and a model only appears once it has at least 10 listings behind it. Asking prices tell you what the market is asking, not what a car will sell for — treat them as your resale ceiling.
Check the resale before you bid
Look up any year, make and model against LocalIQ™ asking prices in your market. 5 free car analyses, no credit card.